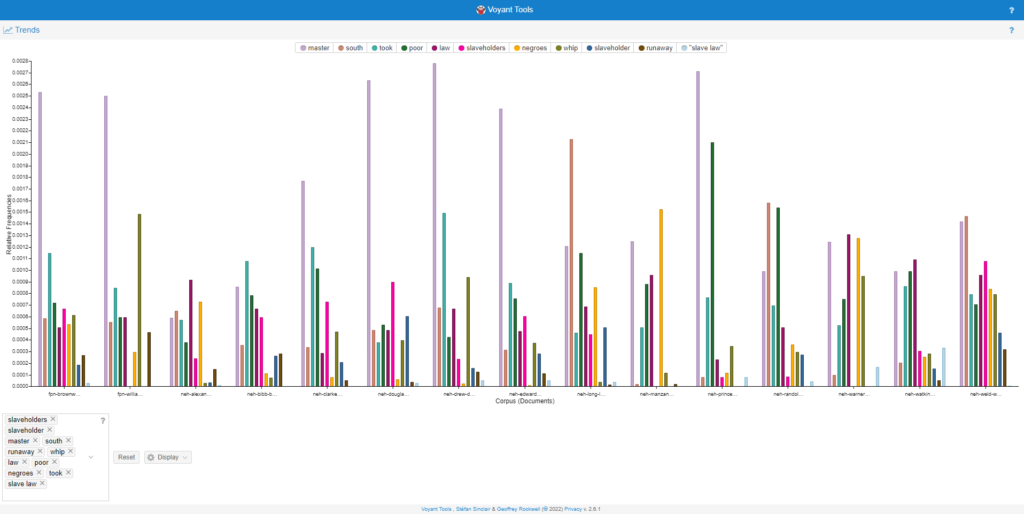
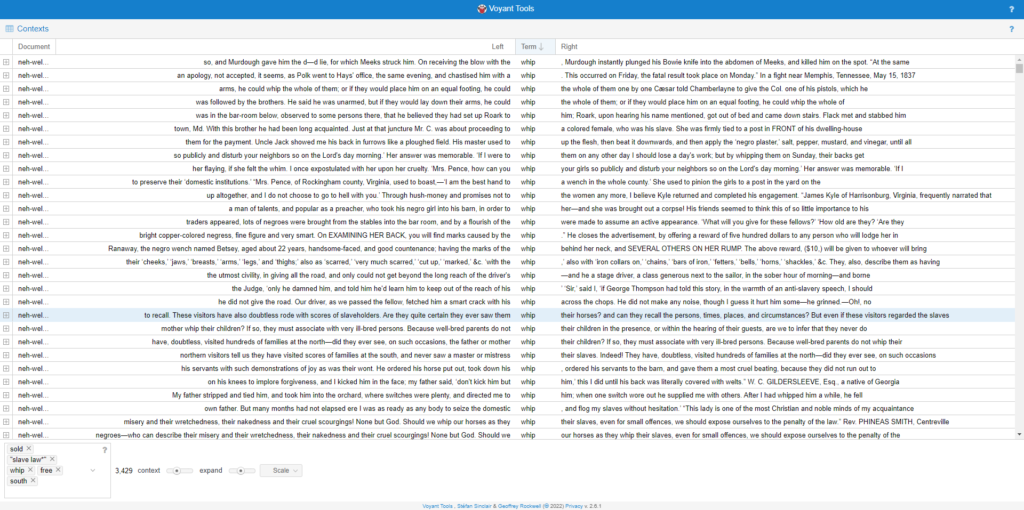
To think like a historian can mean a lot of different things to different people. Over this class my experience as thinking like a historian has greatly improved due to the portfolio activities. The book for the class “Unrequited Toil: A History of United States Slavery” also helped to engage the thoughts of a historian. The way that Calvin Schermerhorn writes about the past lives of slaves get your thought process going. You must use multiple different types of critical thinking using information that’s known and some that’s potentially unknown. Now that I understand to think like a historian I shouldn’t just be using facts that I’ve memorized. I need to take those facts and break them down further. There are multiple techniques we used during the semester to do just this. I will explain a few of the techniques and why they are a great way to break down information that you know to get a better understanding. The first one that comes to mind is computational text analysis. This is a great technique for a couple of reasons. One being it can help you to figure out what an article or primary source is telling you before you take a deeper dive into the content. This helps in all stages of thinking like a historian from taking a look at evidence to making some sort of conclusion on your thoughts. Computational text analysis can also help you to make better inquiries on large pieces of text which can often make the text feel more manageable. This is something that I noticed especially with Portfolio number 6. After I was given such a large number of documents with no knowledge whatsoever about any of the documents. I was able to use computational text analysis to make inquiries which led me to a conclusion of what was taking place in the documents. It was a really broad idea of what was going on but with more time and resources I could’ve used computational text analysis to get an even more deep dive into each document. One of the other resources available to help you think more like a historian is MetaData. I came into this class knowing about the Metaverse but not very much about MetaData at all. MetaData is the online information of a historic piece of work in any form that gives good information about the thing being viewed. This information can help you to make critical thoughts about the when, where, and possibly who of the piece of history you are viewing. As a side piece while talking about MetaData i would like to also mention copyright and how it is used to protect information. Copyright is a common term to users of the internet daily and it helps to make sure that someone’s content is being used fairly and safely. Most historical artifacts are open to the public and do not require you to get permission from the user to use it. There are many different parts to MetaData that make up the backbone of where something is from and where it’s being stored. Another huge contributor to thinking like a historian is learning about Geospatial Analysis. Geospatial analysis is used to get geological data on how people moved and many other things. There are 2 types of geospatial spaces which are  absolute and representational space. Representational space usually doesn’t have numbers to go along with it. It’s more so just a landmark that is significant in some way to the historian looking at the map. These can help to paint a more vivid picture for a historian to know things like where people worshiped or where the school everyone attended is. Absolute space is more of a way to track actual distance traveled. This space does deal with numbers to get the information across so that historians can look at. This can help get a real feel of how far people actually moved. This is one of the methods that I used when creating my Portfolio 8 where I made a small story map of the early life of Frederick Douglass. I used representational and absolute spaces to help me learn the story. Then I used Geospatial Analysis to relay that information that I found out. Something that I could have done better on was using the absolute space to give more detail about how far Frederick traveled during his early life. That would’ve been interesting to know if he had to travel farther than usual since he was black and probably not allowed everywhere. Those are just some of the methods that were used this fall to engage the thought of thinking like a historian. These skills have helped me to take a closer look at readings in all genres but also step back to look at the bigger picture. My overall critical thinking has definitely improved since being in this class. I personally would like to get better at text analysis and possibly become proficient in analyzing text. I think for the field that I would like to work in after college that would be a very helpful skill to have. One thing that I would like to learn more about going forward is data analysis with numbers. I think it would be good to see old ledgers of anything and just look at how businesses were run back then. That would also be useful and make critical comparisons. I am confident in my skill to be able to think like a historian and make critical thoughts. Given the resources needed. I would like to see what other approaches there are to thinking like a historian. I’m sure these approaches, much like the ones from this semester, will be useful for more than just historical thinking. With the skills developed over this course I can say that with more practice and effort into learning more advanced ways to use these skills I can break down a historical or any document with ease and confidence. 

Merry Christmas!!!

When I started to create my map in Flourish I wasn’t sure of what I wanted to look into at first. A lot of the questions that I came up with had a pretty clear answer to it. Then I came up with the idea to see how many men lived from 30 to 59 no matter race or freedom status. This question helped me to dig deeper into the census data. The data that I used specifically is the 1850’s I chose this because I thought that maybe it might be the most accurate. I was able to see that the northern states had low non white male numbers of all ages. That changed of course when looking at the south part of the US. White men are the majority in most counties in the south but there are a few counties were there are more slaves than white men. There is a very small free population in the US at this time. When looking at the map you notice that there aren’t many black people between the ages of 50-59. In the south there weren’t many freed black people to make it to the age 50 with it usually only being about 1 to 3 folks on the census. This helped to show that at this time there were still a huge slave market in the south. While pretty majority of  the rest of the founded states in the US, at the time didn’t have 1 slave in the census. This shows us the biases of the south. If you had a darker pigmentation to your skin in the south the odds of you being a slave were pretty high. This shows why the rates are so high for slave to live to 49 over free men in the south. If you are look at as a slave you can be turned into one with no laws against it. Also you have to live long enough to think about becoming a free man or escape which lots of slaves could do neither.

To start this activity I wanted to look through both sites first to see which one I would be more comfortable working with and I ultimately went with StoryMapsJS( https://storymap.knightlab.com/ ). Once I made my decision on the site I would use next was picking the formerly enslaved persons autobiography. I chose Frederick Douglass. The reason that I chose Frederick Douglass is because when I was doing topic searches through the autobiography a lot of good information showed up next to locations. With that being the case I read through some of the autobiography and when I found a meaningful event I skimmed around. This is to help me locate any possible location given in the text. If it’s clear where the place is I could easily mark it on the story map. If not then I did a little more digging on the internet to help find a more precise location. After I was about to find the event that I wanted to be in the story maps and found the location I made a quick headline and description to explain what that location meant to Frederick Douglass. Once all of that stuff was done I went to google to find photos for some of the slides. I also used the autobiography cover as the cover image to my story map. That’s pretty much the entire process of how I made my story map. I would say the most challenging part about making this was just the amount of reading before me. That and the changes in the naming schemes of some of the places. There were some places so old the name had changed while some still had the exact same name. The fun part was what you found out after reading and doing research. Here is my story map https://uploads.knightlab.com/storymapjs/facb6b62557ea745acffba762ad5949f/the-life-of-until/index.html

Geospatial visualization can help historians answer and ask more questions than before to get a deeper understanding for their research. It can help to paint a more vivid picture if you know when and where something took place. But also knowing more about the location of certain events can lead to better questions. There are 2 main concepts in geospatial visualization, one being absolute space. This concept is what I would call the more technical concept. That’s because this concept deals with distance. It deals with distance in more of a numerical sense to see how far something has come or gone. When thinking about absolute space you want to think about an absolute measure of distance. You want to think about the distance units of measurement such as inches, feet, miles, etc. This can help us to ask more questions such as “how far would a slave have to run to get to New York from South Carolina given a known route?” If given a map with a legend to help you understand the map it will lead us to deeper questions and open our ability to make historical inquiries. The other concept is representation space and I consider the other half of the puzzle. This concept paints the full picture like the lay of the land. It helps to understand where you are based on your surroundings. Representational space helps to associate experience and common gathering ground with physical locations. An example would be a church, where Christian people are known to come and worship the lord but to a regular person might just be a building. Representational space helps to add the content to absolute space (distance). This can really help to dissect and make new and improved questions. With both concepts working together to make a map you can track movement from place to place. There are downsides to both concepts that make them not 100% perfect. For absolute space it is not known what is happening with the land. You know the distance that you traveled but you would know what you’ve passed or possibly even where you came from. It also doesn’t really account for the lay of the land. You could think that going North 100 miles would lead you to a “Ohio” but that doesn’t account for hills and valleys that affect that mileage number. This is one of the ways maps lie to you so maps only account for flat straight distance that don’t give accurate trip information. While on the other hand representational space’s down sides are that it can give a good picture but will not help with knowing relative distance. This is also one way maps lie. Without a guide the distance between areas on a map may be really off making trips possibly longer or shorter. Overall a good map that has absolute and representational visualizations can be used to document travel or make good historical inquiries about travel.

When I first received my set of documents and topic words the first hypothesis that came to mind. These documents are based on the former slaves talking about laws set by law makers for slaveholders oppress black people free and non-free. Also about the harsh work and hardship that the slaves had to endure during captivity with all of this taking place in the south. To test this hypothesis I did a little bit of computation text analysis with the Voyant Tool to get a better understanding of what these topic words mean in the documents. First I put the most relevant topic words that would agree with my thesis into the Trends tool on Voyant and got the first graph below. After getting the graph from Voyant I took note of the similarities in the topic word in each document. I also took a look at the differences such as which documents did not have a word that all the others did have. When I noted the information from the graph I took, I then took the two documents with the most topic word frequency and the two with the least amount of topic word frequency. I will use these documents to narrow down the reading from 10 documents down to 4 so I can skim through to check my hypothesis. Before coming to a conclusion I tried using a few more tools in Voyant. The tool that really caught my interest was the context tool. This is shown in picture 2. This tool allows you to give Voyant a word(s) or phrase and it’ll give you the full sentence that comes before and after the word(s) or phrase you put in. This is useful for quick reading and helps to get context behind some of the topic words. After all of this I stand with my original hypothesis that, “These documents are based on the former slaves talking about laws set by law makers for slaveholders oppress black people free and non-free. Also about the harsh work and hardship that the slaves had to endure during captivity with all of this taking place in the south.” This became very obvious when i searched the phrase “slave law” in the context tool and notice that in every document it talked about how the law is against black people not matter what your status is. I think that my original hypothesis serves as a good base. A better hypothesis would be, “These documents are the accounts of people who has survived slavery and has the brain capacity to write about what happened to them and countless others. These accounts show clearly how the law worked against black people. Being free did not protect you from the white man and slavery is hard to escape. Also the hardships slaves and black people in general had to go through and not just black people from the south. The north was really quick to send black people they did not like back to slavery by selling them out of jails.” I think that this is better due to the depth that I was able to acquire using the Voyant tools.

https://voyant-tools.org/?corpus=925fb954830e7a78fb75b2c2713e399e&view=Trends&query=slaveholders&query=slaveholder&query=master&query=south&query=runaway&query=whip&query=law&query=poor&query=negroes&query=took&query=slave%20law&chartType=bar
https://voyant-tools.org/?corpus=925fb954830e7a78fb75b2c2713e399e&query=slave%20law&view=Contexts

The website that I chose to review is www.whitneyplantation.org. I will be using the Journal of American History’s Digital History Review criteria for my review. First is content. The site is full of content surrounding the Whitney Plantation and the history behind it. It does a great job covering multiple aspects of the plantation. I really like how they cover a large scale of the slavery that took place at the Whitney Plantation. By visiting either the history section(https://www.whitneyplantation.org/history/ ) or the education section both take you to more in-depth menus. These menus help to split the history into manageable pieces as not to overwhelm the reader with a lot of content under one section. Second is design which is really simple and makes navigating the site a breeze. Each tab is labeled in a way that you’ll never really have to guess if you’re going the right way. The site is easily accessible to anyone and especially if you’re looking for information on the Whitney Plantation. The site works just as great on the mobile furthering its accessibility to anyone. Third is the audience that the site was created for. This site was created for people wanting to learn about the plantation and possibly get a chance to visit the historic site of the plantation itself. The site does a great job doing both of those things(https://www.whitneyplantation.org/overview-and-tickets/). It offers a great deal of history about the plantation right on the site and has a very obvious button to help you book a trip to the plantation. Fourth is the digital media aspect of the site. With all the work put into this site from text to hyperlink to media I can see this as any other media form than a website. Lastly are the creators. Although it doesn’t specifically say any creators or contributors. I can make a pretty good assumption that there is a team of contributors behind the site itself and the content presented. 

After I found my primary source on Library of Congress website using the search slaves in the south. I also searched for slave trade in America. When I found my images creating the item was pretty straightforward. Most of the metadata that I needed to fill in the image’s Dublin Core was easily available right up under the image. The description was not too challenging although it’s an image. The metadata helped me to interpret the image more precisely so that I can make the image more clear to the public. I read it closely to interpret what’s going on in the image. Using images did make it a little harder to do close reading but with critical thinking I was able to make a description. I did my best to give an accurate description of what was created. The thought of annotating for a public crowd made me approach how I look at each image more carefully. I wanted to make sure that I can help people to understand what’s going on in the image. This will also hopefully spark a question that will lead you deeper in to the research of slavery in America.

Exhibit: https://h251.omeka.net/exhibits/show/fall-2022–grappling-with-prim/slavesinamerica

Item 1: https://h251.omeka.net/items/show/112

Item 2: https://h251.omeka.net/items/show/113

Hello everyone my name is Noah. I’m a junior and I’m pursuing a bachelor’s degree in Economics. I joined this class because of the minor that I selected and also because I’m interested in increasing my digital knowledge. I look forward to learning how we will combine the book of the class with the theme of the class. That’s the educational stuff now more about me personally. I like to workout but more for staying in shape than anything else. I usually go to the gym pretty early to get a good start to my day followed by a protein shake. I got my first apartment this year and although it’s more expensive than I wanted it to be, it’s been great. I stay with my girlfriend of 5 years (going on 6). I’m an introvert but I want to break out of my shell and extend to more people. Besides doing school work I watch a lot of YouTube, some entertainment and some educational but it’s usually educating me on something random that I didn’t need to know but it’s interesting. My girlfriend and I have a YouTube channel that we haven’t posted on in a while but now we are trying to get back on track. Another thing that I like to do is play video games. One of the games I play the most is Apex Legends and 2k22 because I don’t want to pay for 23 just to grind again. I’ll probably still get it later. I’m not really good at Apex. I usually get online to play with friends. Lastly is my love of food although due to me staying fit and working out I eat less I still love what I eat. That’s a little about me. I’m excited for the class and the contents we will learn.